Monthly Archives: March 2011

Diversion: Advice You Should Follow (or Not)

Note: While the this blog is devoted to dimensional stone and allied subjects, Diversion offers some not-so-off-topic insights … including some thoughts on technology.

When it comes to quoting the ultimate authority, someone in a crowd is bound to utter, “I read it in the New York Times.”  And, by and large, what’s printed in the Times is good authority … unless it happens to be part of a rather clever PR strategy like, uh, radon and killer countertops.

No, this isn’t another journey into the land of picoliters. Instead, let’s take a look at some rather declarative Times advice about personal technology, as presented in this March 23 Sam Grobart article at nytimes.com: “Gadgets You Should Get Rid Of (or Not)”.

Rather than quote extensively – you can read the whole thing yourself, but don’t trip on that new paywall – I’ll offer the list and the short summary of the device.

Desktop computer: Lose it (laptops are just as good).
High-Speed Internet at Home: Keep it (it’s better than a cell-phone-based hookup).
Cable TV: Depends (mainly good for sports freaks).
Point-and-Shoot Camera: Lose it (smartphones are great).
Camcorder: Lose it (smartphones are great).
USB Thumb Drive: Lose it (cloud computing is better).
Digital Music Player: Lose it (smartphones are great).
Alarm Clock: Keep it (simpler than a smartphone).
GPS Unit: Lose it (smartphones are great).
Books: Keep them (no batteries needed, available at libraries).

Since I’ve lived most of my years as a contrarian, I have no problem disagreeing with most of Mr. Grobart’s list – in that I’m not in favor of losing any of the gadgets on the toss list. For now, keep ‘em all.

I’m sure Mr. Grobart’s thinking of the casual users of technology who catch streaming-video presentations of half-hour sitcoms and take videos of the kids’ birthday parties. If you’re not really depending on any of these devices, maybe it’s time to simplify your next round of device buys.

However, if you’re using any of these devices in any way that’s related to business – or you’re going to wander 20 miles or so away from a U.S. metropolis for any reason – don’t trim that gadget list. You’ll need them.

As a personal-computer owner since 1986, I’ve seen plenty of developments, but none match the performance-per-dollar you’ll get from that unsexy utilitarian desktop. Not that I’d disdain a laptop – I own several – but the portable is prone to more wear-and-tear, not to mention the possibility of loss or theft. Laptops also tend to promote a user reliance on wifi Internet connection, which is far from universal or ideal in many circumstances.

When the ‘Net is absent, a thumb drive is invaluable. While I use the online cloud concept (Microsoft’s SkyDrive, for example), it’s a no-brainer to carry a little USB stick for documents, presentations and photos. It also allows the use of someone else’s computer – I posted several items from Coverings using press-room computers, transferring work from a wifi-dead laptop. (If you get clever, you can copy your DVDs to AVI or MPEG files to a thumb drive and watch them on a laptop while traveling.)

Where I don’t get clever is with my mobile phone. To be very honest, I don’t have a smartphone; for one thing, I’m not keen to dish out another $400-$500 just in connection fees. And, in 25 years of owning personal technology, I’ve learned that the more tasks you assign to one device, it’s more-certain that you’re going to brick it.

Smartphones are marvelous pieces of technology, but their main purpose is enabling voice calls. Yes, you can do hundreds of other tasks with a smartphone, but it doesn’t do them as well as specifically designed devices like GPS units or point-and-shoot cameras.

It’s a major shock for some people to learn that large areas of the United States outside major metro areas have gaps in cellular service; hit a soft spot, and something like GPS goes dark. And photo/video recording quality remains relatively low on smartphones when compared to the cheapest camera or pocket camcorder.

Trying to make that smartphone do all these things pushes it closer to breakdown; keep ordering it to do more and, like most other electronic devices, it hits the limit and seizes up. If you’ve tossed everything else, you’ll be left holding a very expensive electronic brick.

Sure, this sounds like the old guy who just isn’t getting it, and he should just move on. But, in a quarter-century, I’ve learned that every good gadget has its reason for being in my bag of technology tricks – and I’ll need a better reason for pitching them than a New York Times say-so.

Emerson Schwartzkopf

You can read up-to-the-minute news on the dimensional-stone trade and search the archives at Stone Business Online, where you can also find this blog at the Main Menu under the clever heading of “Blogs.”

Get the best in insightful and informed coverage of the stone industry every month with Stone Business magazine. Sign up for a free subscription (or renew your current account) and don’t miss a single issue – just click here.

The advertisements that appear on this page are placed by wordpress.com, and constitute no endorsement of the products or services. And I don’t get a dime from any of them, either.

StatWatch: Jumping Up In January ‘11

StatWatch is a snapshot of U.S. dimensional-stone imports, offering a summary and exclusive Stone Business analysis of data from the U.S. International Trade Commission. Comparisons are made mainly on an annual level to gauge market trends. Analysis is made on import figures of the latest month available.

All figures give are for January 2011 (change from January 2010 amounts in parentheses). “Worked” stone is material that’s shorn from boulders and blocks, and then cut in standard dimensional measures (such as slabs and tiles) and polished (at least once, one side).
 
WORKED GRANITE VALUE
Total: $73.7 million (9.2%)
Sector leader: Brazil @ $32.5 million (14.9%)

Backfill: Brazil remains as the #1 player in U.S. worked-granite imports, providing 44 percent of total import values in January. However, that $32.5 million also represents the sixth straight month of decline from last July’s $44.2 million.
The remainder of granite’s Big Four shows a reasonably good start to 2011 – China at $18.2 million (up 7.8 percent) and Italy at $9 million (up 4.1 percent). India notches a decline from January 2010, but its $8.6-million total for this January is only a 1.6-percent dip.

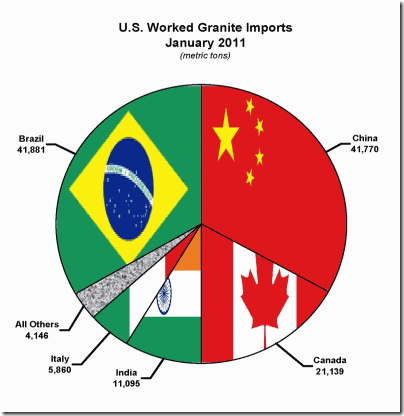
WORKED GRANITE VOLUME
Total: 126,891 metric tons (54.5%)
Sector leader: Brazil @ 41,881 metric tons (27.9%)

800_jan11_granite

Backfill: When import tonnage increases by half-again for a stone, there’s usually a bogey in the mix; this time, it’s Canada. This is no diss to our friendly neighbors to the North, but the 21,139 metric tons shown for January is a 1,982.7-percent blast-off from January 2010 totals – and not that far behind the 2010 total of  27,568 metric tons Canada sent south.
The hot story for 2011 in granite imports may be the heavy loads of Chinese containers; the January shipment of 41,770 metric tons is a 55.7-percent leap from the previous January, and only 111 metric tons below first-place Brazil. India keeps relatively stable at 11,095 metric tons (down 0.7 percent), while Italy drops 9.1 percent to 5,860 metric tons.

WORKED MARBLE VALUE
Total:
$14.4 million (-4.7%)
Sector leader: Italy @ $6.1 million (7.6%)

Backfill: You can’t say that January is any change from the previous month. Seriously. Both January 2011 and December 2010 are at $14.4 million; at least this January shows less of a 12-month dip than last December.
Along with Italy’s improvement, Turkey offers some good news; its $1.4 million in worked-marble import value is 17.8 percent of last year’s start. Not so for others with U.S. imports of $1-million-plus; China’s $3.7 million is 8.2 percent behind January 2010, and Spain takes a 28.9-percent tumble to $1.3 million.

WORKED MARBLE VOLUME
Total: 13,466 metric tons (-7.0%)
Sector leader: China @ 4,874 metric tons (-18.5%)

Backfill: China retains its lead in worked-marble shipments to the United States, albeit losing a large chunk of margin to Italy; its 3,514 metric tons represents a 9.7-percent increase from January 2010.
Turkey shores up its third-place status with 1,817 metric tons in January (up 28.9 percent), ahead of Spain’s 1,526 metric tons (down 22.7 percent). Spanish exporters don’t need to fear dropping another notch anytime soon; fifth-place Greece shows a 15.8-percent annual gain in January, but with only a total of 249 metric tons shipped to the United States.

TRAVERTINE VALUE
Total: $19.7 million (12.0%)
Sector leader: Turkey @ $14.2 million (14.7%)

Backfill: Turkey remains the unchallenged market leader in U.S. travertine imports, whether it’s in value or tonnage. And, while they continue a two-thirds domination of the market here, Turkish producers received some help in lifting values past January 2010 levels.
Mexico improves its second-place position in January 2011 values at $2.6 million, up 2.8 percent from last year’s start. China, meanwhile, boosts its U.S. travertine values by 49.6 percent to $1.1 million, helping to offset the first-month declines of Italy ($654,335, down 12.6 percent) and Peru ($612,368, down 10.1 percent).

TRAVERTINE VOLUME
Total: 33,759 metric tons (7.1%)
Sector leader: Turkey @ 27,823 metric tons (5.9%)

800_jan11_travertine

Backfill: Travertine shipments remain strong, with Turkey taking its usual lead to begin 2011. However, the overall total shows better growth than Turkey’s production alone, indicating some growth in exports from other countries.
Mexico’s 3,235 metric tons in January 2011 offers a 14.8-percent hike from last year’s beginning, but the big boom comes with China’s 1,261 metric tons representing a 54.9-percent rise. Italy’s 468 metric tons in January made for a 34.1-percent gain; only Peru reverses course, with an 18.6-percent decline at 561 metric tons. 

OTHER CALCAREOUS VALUE
Total: $7.5 million (2.9%)
Sector leader: Italy @ $1.2 million (-22.7%)

Backfill: When the lead country sending a stone to the United States takes a 20-percent-plus tumble in its import value, the entire sector often takes a dive with it. For this non-marble category, however, other suppliers pick up the pace in January.
Portugal, at $1 million, increases its shipment values from January 2010 by 49.3 percent to whip by China and France for second place. France is no slouch either, pumping up the levels of last January by 41.9 percent to reach $856,039; however, that’s only good enough for fourth, as China places third at $954,137 (a paltry 2.4 percent ahead of last year’s level). Other strong gainers in the $500K+ range are Spain ($655,787, up 76.9 percent) and Turkey ($553,697, up 11.7 percent).

OTHER CALCAREOUS VOLUME
Total:
8,448 metric tons (-89.9%)
Sector leader: China @ 2,599 metric tons (7.1%)

Backfill: The terrible comparison with January 2010 is the result of the imports of Lebanon; the country made up more than three-quarters of all U.S. other-calcareous tonnage before disappearing from the market last May. So, let’s cut out Lebanon’s 45,365 metric tons from last January, along with a combined 5,802 metric tons in one-month-wonder shipments from the Philippines and India. That brings January 2010 down to 9,148 metric tons, making the difference with this January a more-realistic -7.6 percent.
Along with China’s gains, Italy increases its first-month totals by 19.5 percent to 1,074 metric tons; Spain’s 669 metric tons shows a 11-percent gain. On the down side, consider Portugal (877 metric tons, -6.1 percent), Turkey (589 metric tons, -51.4 percent) and France (494 metric tons, -20.0 percent).

SLATE VALUE
Total: $4.7 million (50%)
Sector leader: China @ $2.0 million (13.2%)

Backfill: China opens up a slightly longer lead on India in January 2011, although that’s due more to the latter country’s 5.5-percent decline (with $1.7 million in import value) from the beginning of last year.
The distant third- and fourth-place shippers of non-roofing slate continue to make good gains. Brazil, at $450,582, moves up 24.7 percent from January 2010, while the United Kingdom’s $243,029 marks a 93.5-percent leap.

Emerson Schwartzkopf

Get the best in insightful and informed coverage of the stone industry every month with Stone Business magazine. Sign up for a free subscription (or renew your current account) and don’t miss a single issue – just click here.

You can read up-to-the-minute news on the dimensional-stone trade and search the archives at Stone Business Online.

The advertisements that appear on this page are placed by wordpress.com, and constitute no endorsement of the products or services. And I don’t get a dime from them, either.

StatWatch: U.S. Stone Imports, December 2010

StatWatch is a snapshot of U.S. dimensional-stone imports, offering a summary and exclusive Stone Business analysis of data from the U.S. International Trade Commission. Comparisons are made mainly on an annual level to gauge market trends.

All figures give are for December 2010 (change from December 2009 amounts in parentheses). “Worked” stone is material that’s shorn from boulders and blocks, and then cut in standard dimensional measures (such as slabs and tiles) and polished (at least once, one side).
 
WORKED GRANITE VALUE
Total: $79.7 million (8.53%)
Sector leader: Brazil @ $33.0 million (9.0%)

Backfill: December becomes the middling month in granite value for the recovery year of 2010; while Brazil advances from the end of 2009, the increase fails to reach the 33-percent climb seen in November 2010. India makes a strong showing at $12.4 million in customs value to show a 51-percent hike from December 2009 – but it only moves the country into third place.

China again shows a small decline – two percent – with its $18.5 million in value. And, Italy, at $10.1 million, doesn’t move much at all (-0.4 percent). The surprise of last year remains Saudi Arabia, going from sub-$100,000 months in 2009 to a strong finish of $811,052 in December 2010.

WORKED GRANITE VOLUME
Total:
156,213 metric tons (84.1%)
Sector leader: India @ 62,225 metric tons (499.8%)

Click to enlargeBackfill: Granite import values may be wishy-washy, but last December’s tonnage likely put a dent in U.S. docks. India dramatically reverses a second-half 2010 downward slide, sending more granite to the United States in December than in the previous four months combined. Brazil moves to #2 for the month, but its 42,123 metric tons are a 14.4-percent increase from December 2009.

China finishes a comparably weak second-half 2010 with 25,518 metric tons, down 2.9 percent from December 2009. Italy, meanwhile, posts its third-best month of 2010 with 20,174 metric tons, up 210.7 percent from the previous December.

WORKED MARBLE VALUE
Total: $15.2 million (-7.1%)
Sector leader: Italy @ $6.5 million (-17.4%)

Backfill: Last December proves to be a lumpy flight for marble’s import values, as Italy’s decline accounts for falling farther behind 2009’s tepid pace. Spain also records a significant drop – $1.4 million, down 32.4 percent – from December 2009, while Israel freefalls to $89,278, a 73.3-percent decline.

December 2010 also shows some high points, though, as China sends $3.9 million in worked-marble value, up 23.8 percent from the previous December. Turkey bumps up its marble imports by 23.9 percent to $1.2 million, and Greece finishes 2010 in decent fashion with $439,149, up 37.1 percent from December 2009.

WORKED MARBLE VOLUME
Total: 14,125 metric tons (-0.8%)
Sector leader: China @ 5,309 metric tons (-1.5%)

Backfill: The lead for top worked-marble exporter to the United States changes hands again, as China ships 5,309 metric tons in December 2010. Sharp-eyed observers will also note that China increased worked-marble customs value while decreasing import volume, which means the country’s getting more for its stone at the end of last year.

Last December also finds few slouches as far as tonnage totals; Italy’s 3,652 metric tons offers a 1.6-percent increase while Turkey pumps up its shipments by 82.9 percent to 1,983 metric tons. Only Spain shows any major loss among the top exporters, with its 1,444 metric tons representing a 33.7-percent decline from December 2009.

TRAVERTINE VALUE
Total:
$17.8 million (2.5%)
Sector leader: Turkey @ $11.5 million (8.2%)

Backfill: December 2010 shows the shipment values declining from major exporters, save the one that matters – Turkey, since it controls more than two-thirds (by value) of the U.S. travertine-import market. China makes some positive noise, moving up 29 percent from December 2009 to 914,412 metric tons.

Mexico still lags behind 2009, with last December’s nearly $3.2 million representing a 9.3-percent drop. Peru also fails to exceed December 2009, with $954,870 showing a 6.9-percent decrease. Italy finishes an up-and-down year on the down side, with its $714,213 behind December 2009 by 36.7  percent.

TRAVERTINE VOLUME
Total: 28.281 metric tons (1.8%)
Sector leader: Turkey @ 21,236 metric tons (1.9%)

Backfill: It’s not hard to see Turkey’s shipments to the United States keep near-exact pace with the total tonnage of travertine entering the country. For every four tons of travertine accepted at ports-of-entry, Turkey accounted for three of them in December 2010.

At 3,947 metric tons, the imports from Mexico in December 2010 mark the second-worst month of the year, but it still beats the end of 2009 by 1.7 percent. China manages a 59.5-percent boost to 976 metric tons; Peru’s 939 metric tons shows a 12.3-percent decline from December 2009. 

OTHER CALCAREOUS VALUE
Total:
$6.3 million (-29.5%)
Sector leader: Italy @ $1.0 million (-33.7%)

Backfill: Even without the Lebanon Effect (and we’ll get to that soon enough), this category of limestone and other like stones remains a laggard for 2010. Long the leader, Italy may be surpassed soon by one of three other candidates with decent December 2010 showings: France ($835,645), China ($814,898) or Portugal ($779,273). China became the only one of the lot to post a gain from December 2009 at 36.1 percent.

Only two other countries with more than $200,000 of import values managed an annual gain in December 2010 – Mexico ($574,593; 22.7 percent) and Egypt ($342,491; 233.0 percent).

OTHER CALCAREOUS VOLUME
Total: 8,404 metric tons (-89.9%)
Sector leader: Portugal @ 1,549 metric tons (44.9%)

Backfill: The drastic drop-off is the result of the Lebanon effect; that Mideast country dominated the U.S. import market for other calcareous until last June, when it stopped shipping any of the stone here. However, even if Lebanon’s 71,483 metric tons in December 2009 is discounted, the imports in December 2010 still show a decline of 28.9 percent from the previous year.

The market’s not a total disaster in December 2010; besides Portugal’s upswing, the 1,298 metric tons from Italy offer a 77.6-percent gain from  the previous year, and Israel finds a place to pep up with 789 metric tons, a 163-percent improvement.

SLATE VALUE
Total:
$4.6 million (11.9%)
Sector leader: China @ $1.9 million (13.3%)

Backfill: China widens its lead over India in dimensional, non-roofing slate during December 2010, although both fall short of the $2-million values each racked up in November 2010.

Behind slate’s Big Two, December 2010 data show that Brazil ($433,442, up 52.2 percent from December 2009) and the United Kingdom ($292,128, up 107.1 percent) continue to gain interest.

Emerson Schwartzkopf

You can read up-to-the-minute news on the dimensional-stone trade and search the archives at Stone Business Online.

Get the best in insightful and informed coverage of the stone industry every month with Stone Business magazine. Sign up for a free subscription (or renew your current account) and don’t miss a single issue – just click here.

The advertisements that appear on this page are placed by wordpress.com, and constitute no endorsement of the products or services. And I don’t get a dime from them, either.